Building Prewave's 360° Supplier Scoring Platform
How we engineered real-time risk scoring across 200+ categories for enterprise supply chains — Angular micro-frontends, Kotlin backends, and the hard problems in between.
At Prewave I was part of the team building the 360° Supplier Scoring feature — one of the core pillars of the platform that enterprise clients use to assess and monitor supply chain risk in real time.
Prewave was recently named a Leader in the Gartner® Magic Quadrant™ 2026 for Supplier Risk Management Solutions, which speaks to how seriously the product is taken at the enterprise level. Being part of that journey was one of the more technically demanding frontend roles I've had.
What is the Scoring platform?
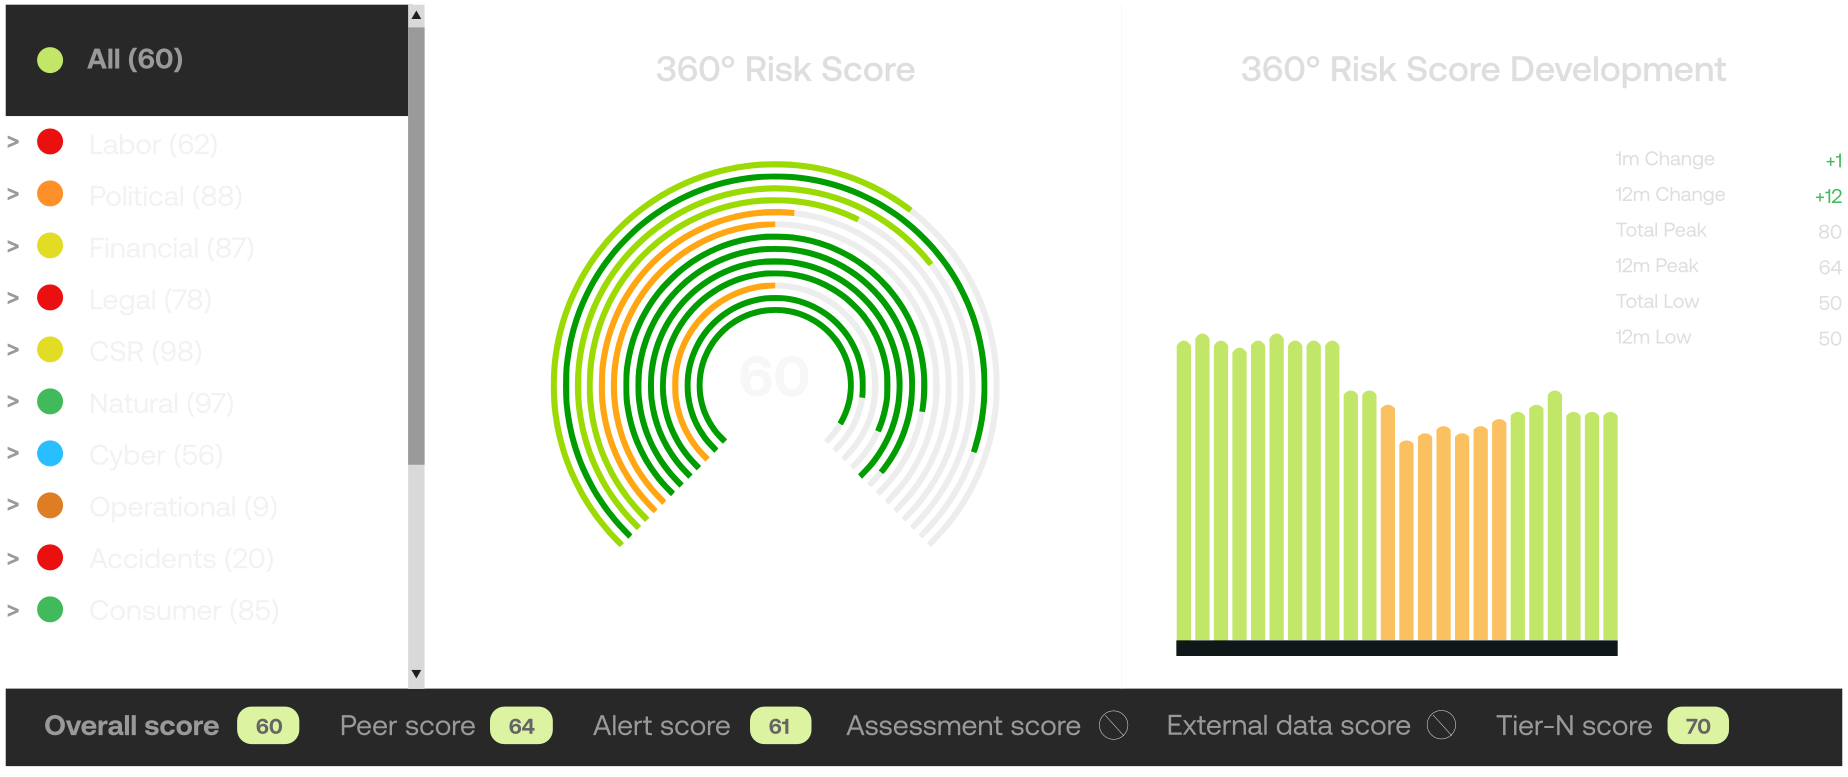
The Scoring feature gives procurement teams a single, continuously updated risk score for every supplier in their network. Under the hood it aggregates signals across 200+ risk categories — ESG, financial stability, regulatory compliance, geopolitical exposure — and surfaces them through a clean dashboard built for fast decision-making.
The product follows a three-stage loop:
- Integrate — connect supplier data from existing ERP/procurement systems
- Analyze — get continuously updated risk scores powered by real-time data ingestion
- Monitor — track score changes over time with alerts when thresholds are crossed
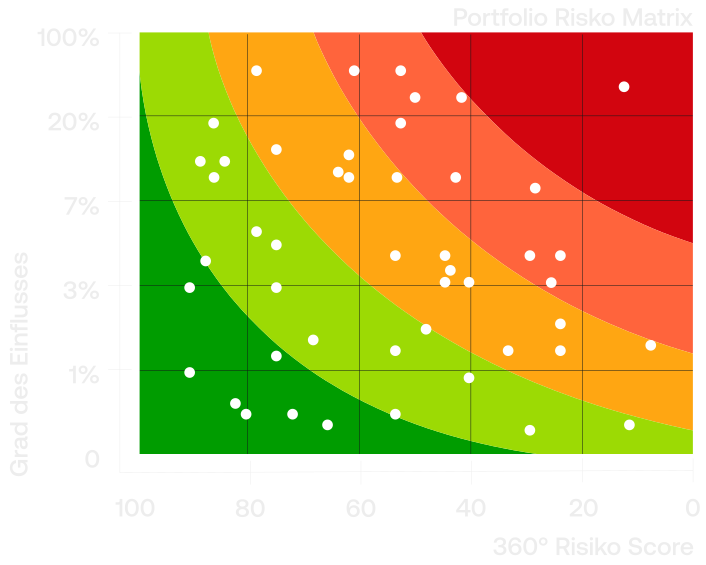
The risk matrix gives risk managers a prioritised view of which suppliers need immediate attention versus which can be monitored passively.
My role
I joined the team as a Senior Software Engineer working across the Angular micro-frontend and the Kotlin/Spring Boot backend services that feed the scoring UI.
On the frontend side, Prewave operates a micro-frontend architecture — each feature area lives in its own independently deployable Angular application. This means strict module boundaries, a shared design system, and close attention to bundle impact on the host shell. Getting score breakdowns, trend charts, and the risk matrix rendering consistently across micro-frontend boundaries took meaningful coordination.
On the backend, I worked with Kotlin and Spring Boot in an event-driven setup — risk signals flow through Kafka topics and the scoring engine recomputes supplier scores as new events land. The challenge was making the frontend feel real-time without hammering the backend with polls: we used a WebSocket layer to push score delta events to connected clients.
The hard engineering problems
Rendering 200+ risk categories without overwhelming users. The raw score model is a tree — top-level categories with weighted sub-signals. We built a collapsible score breakdown component in Angular that lets analysts drill from the composite score all the way down to the individual signal that moved the needle. Getting the animation and state management right across the expanded/collapsed tree took a few iterations.
Benchmarking across a global supplier graph. The platform compares a supplier's score against regional and sector peers. Computing percentile ranks across millions of supplier-signal pairs in near real-time meant the backend aggregation needed to be precomputed and cached intelligently. On the frontend, showing "better than 73% of peers in the Automotive sector" sounds simple but requires careful data modelling to avoid misleading comparisons.
Micro-frontend performance at scale. Each Angular app is lazy-loaded into the shell. Scoring loads a lot of chart data, so we invested time in virtual scrolling the supplier list, code-splitting the chart library, and using Angular's OnPush change detection throughout to avoid unnecessary re-renders when score events arrive over the WebSocket.
What I'd do differently
The micro-frontend boundary worked well for team autonomy but made it harder to share reactive state across feature areas. If I were starting again I'd invest earlier in a shared event bus — something lightweight like a typed BehaviorSubject service in a shared library — rather than letting each team evolve their own state patterns.
I'd also push harder for a single shared charting library from the start. We ended up with two different chart libraries in two different micro-frontends, which doubled the bundle weight unnecessarily.
Prewave is a technically serious product solving a genuinely hard problem — making global supply chain risk legible to humans who need to act on it quickly. The Scoring feature is where a lot of that complexity surfaces, and it was a satisfying problem to work on.